Quick start guide
This page demonstrates how to make your first GW mock catalogue, containing both astrophysical and primordial black holes. Further uses of the code are shown in the example notebook.
First, we import the relevant packages:
import numpy as np
import matplotlib.pyplot as plt
from darksirens.mock_maker import compute_GWmock
Specify the cosmological parameters (the code assumes flat \(\Lambda\) CDM for now),
cosmopars = {'Omega_m': 0.315,
             'H0': 67.4}
Specify:
the survey (only Einstein Telescope in the ET-D configuration available at the moment),
the minimum and maximum redshifts
the length of the observing run in years
the minimum signal-to-noise ratio for a viable GW detection
whether to include the effect of weak gravitational lensing on the signal and the noise
whether to add a random spread to the conversion from redshift (unknown in reality) to luminosity distance (only measurable quantity in reality).
specs = {'survey': 'ET-D',
         'z_min': 0.001,
         'z_max': 100,
         'Tobs': 1,
         'SNR_min': 8,
         'include_lensing': False,
         'data_spread': False}
Set the progenitor type and the ABH and PBH parameters. For the ABHs we have the mass and three parameters which control the merger rate. For the PBHs, we have the mass, whether or not to take clustering into account, and the fraction of dark matter contained in PBHs.
progenitor = 'mixed'

ABHpars = {'ABHmass': 7,
           'z_m': 2.,
           'a': 2.37,
           'b': 1.8}

PBHpars = {'PBHmass': 10,
           'clustering': 'yes',
           'fPBH': 1.e-5}
Compute the mock catalogue. You can add an optional path to this function if you want to save the data to file.
data = compute_GWmock(cosmopars, progenitor, ABHpars, PBHpars, specs)
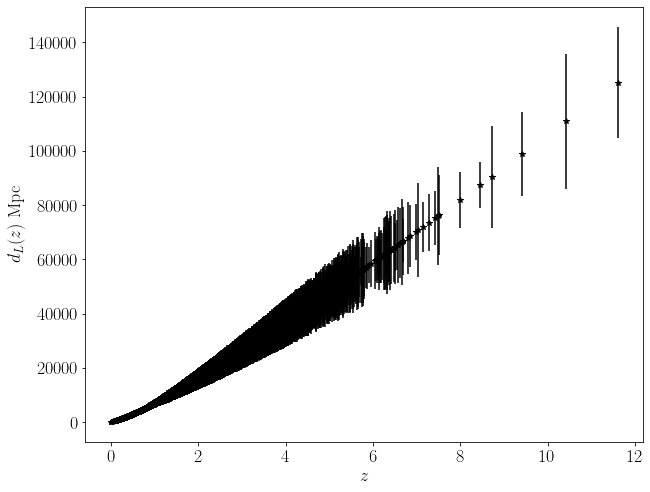
You can now plot your mock data, for example the distances and their errors,
plt.figure(figsize = (10,8))
plt.errorbar(data.mock['z'], data.mock['dL'],
             yerr = data.mock['dL_error'],
             ls = '', marker = '*', color = 'black')
plt.xlabel(r'$z$')
plt.ylabel(r'$d_L(z)$ Mpc')
plt.show()
More detailed information and further uses for the code are shown in the example notebook.
Every program has (at least) two purposes: the one for which it was written, and another for which it wasn’t. — Alan Perlis